
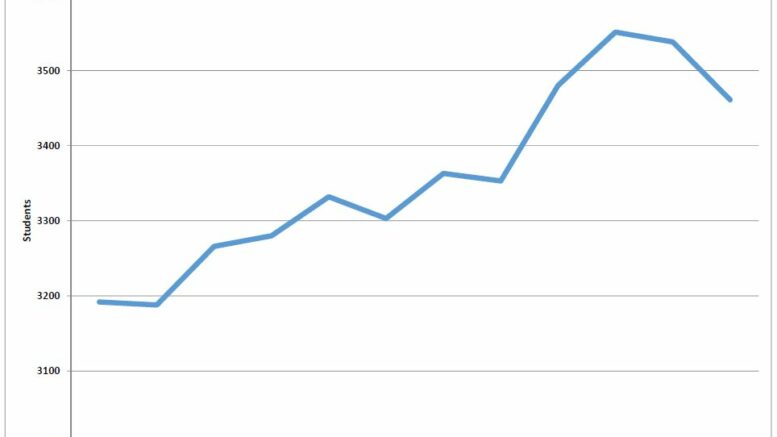

Guthrie Public Schools saw a decrease in students within the school district for the 2016-17 school year compared to last year’s school year.
For the current school year (2016-17), numbers from the State Department of Education reflect an enrollment of 3,461 students from pre-kindergarten to high school compared to 3,538 last school year (2015-16). A difference of 77 students.
“This is the second drop in enrollment district-wide in my five years in Guthrie. We can trace most of the decline locally to economic factors with the downturn in energy sector jobs,” Guthrie Superintendent Dr. Mike Simpson said.
Four of the five elementary schools saw a decrease in student population. Guthrie Junior High (GJHS) was one of two school sites to see an increase, while the Guthrie High School (GHS) reflected a slight decrease.
Fogarty Elementary (second and third grade) decreased from 571 to 556 students, Cotteral Elementary (first grade) from 423 to 383 and Central Elementary (Pre-K and kindergarten) went from 272 to 234 students. Guthrie Upper Elementary School saw an increase going from 765 to 784 students.
In total, the four elementary schools decreased by 74 students.
GJHS (seventh and eighth grade) increased 13 students going from 495 to 508 students. GHS dropped 16 students from 1012 to 996.
“Statewide, the growth slowed dramatically from recent years as well,” Simpson said. “Just as a frame of reference, in 2005, we had just under 3,200 students, the trend has shown growth over time. Traditionally, following an economic recession, our enrollment has spiked such as the growth between 2012 and 2014. When you mix that trend with our residential growth inside the district boundaries, I would expect the growth to continue over time.”
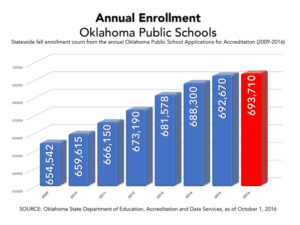
The number of students enrolled in Oklahoma public schools continued to rise in 2016, increasing by more than 1,000 from the previous year.
A total of 693,710 students were enrolled in pre-kindergarten through 12th grade at the start of the school year, an increase of 1,040 over the 2015 total of 692,670 and 27,560 more than in 2011.
 State Superintendent of Public Instruction Joy Hofmeister said the increase in enrollment does not come as a surprise.
“Oklahoma schools are educating more students than ever before. Over the past decade, student enrollment has risen steadily, as have funding challenges. We must do everything we can to maximize our resources in order to serve a growing and increasingly diverse group of Oklahoma schoolchildren,” Hofmeister said.
Districts record enrollment every year on Oct. 1 and report the figures to the Oklahoma State Department of Education. Currently, Oklahoma has 513 public school districts and 1,787 school sites, including 13 charter schools not sponsored by a district.
The list of the 10 largest districts is identical to last year’s, although some changed position within the ranking. This year’s 10 largest districts are:
- Oklahoma City Public Schools: 45,757 students
- Tulsa Public Schools: 40,459
- Edmond Public Schools: 24,403
- Moore Public Schools: 24,355
- Putnam City Schools: 19,475
- Broken Arrow Public Schools: 19,059
- Union Public Schools: 15,983
- Norman Public Schools: 15,942
- Lawton Public Schools: 14,747
- Mid-Del Schools: 14,302
Among those districts, Moore had the greatest year-to-year growth, increasing 1.95 percent over 2015, followed by Edmond with an increase of 1.7 percent and Broken Arrow, which jumped 1.01 percent. Putnam City and Oklahoma City grew less than 1 percent. Enrollment decreased up to 2 percent in Union, Norman, Tulsa, Lawton and Mid-Del.
Statewide, student population percentages shifted slightly this year. Most significantly, the percentage of white students dipped below 50 percent in the first time in state history. The number of Native American students also decreased, while the percentage of Hispanic students and students of two or more ethnicities increased. This school year, Oklahoma’s student population is*:
- 49.36 percent white
- 16.81 percent Hispanic
- 13.94 percent Native American or Alaskan Native
- 8.77 percent black
- 8.78 percent two or more races
- 2.34 percent Asian, Hawaiian or Pacific Islander
*Numbers are rounded and may not add up to 100.
To view the spreadsheets with state, district and site totals, visit http://sde.ok.gov/sde/documents/state-student-public-enrollment

Be the first to comment on "GPS sees drop in enrollment numbers; slight increase for the state"